
The main purpose for this project was learn/practice some Tailwind and data charts, it was a very short one and I had a lot of fun.
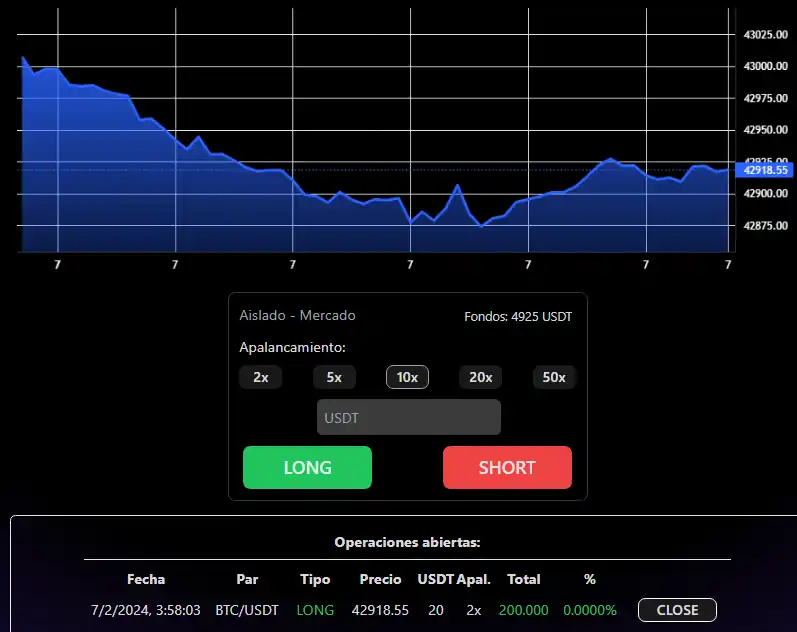
Diving into the world of financial data visualization, this project harnesses the power of Lightweight Charts, a high-performance library designed specifically for displaying interactive financial time series data.
Crafting these dynamic charts involves fetching real-time or historical data, configuring the chart's appearance for clarity and readability, and integrating features like tooltips or crosshairs for user interaction.
The beauty of Lightweight Charts lies in its efficiency, smoothly handling large datasets while remaining responsive across devices. This allows for the creation of professional-grade trading views directly within web applications, providing users with powerful analytical tools without sacrificing performance or user experience.
Chart Component:
import { createChart, ColorType } from "lightweight-charts";
import React, { useEffect, useRef } from "react";

export const ChartComponent = props => {
  const { data, colors: { backgroundColor = "#161616", lineColor = "#2962FF", textColor = "white", areaTopColor = "#2962FF", areaBottomColor = "rgba(41, 98, 255, 0.28)" } = {} } = props;

  const chartContainerRef = useRef();

  useEffect(() => {
    const handleResize = () => {
      chart.applyOptions({ width: chartContainerRef.current.clientWidth });
    };

    const chart = createChart(chartContainerRef.current, { layout: { background: { type: ColorType.Solid, color: backgroundColor }, textColor }, width: chartContainerRef.current.clientWidth, height: 300 });
    chart.timeScale().fitContent();

    const newSeries = chart.addAreaSeries({ lineColor, topColor: areaTopColor, bottomColor: areaBottomColor });
    newSeries.setData(data);

    window.addEventListener("resize", handleResize);

    return () => {
      window.removeEventListener("resize", handleResize);

      chart.remove();
    };
  }, [data, backgroundColor, lineColor, textColor, areaTopColor, areaBottomColor]);

  return <div ref={chartContainerRef} />;
};

const initialData = [
  { time: "2018-12-22", value: 32.51 },
  { time: "2018-12-23", value: 31.11 },
  { time: "2018-12-24", value: 27.02 },
  { time: "2018-12-25", value: 27.32 },
  { time: "2018-12-26", value: 25.17 },
  { time: "2018-12-27", value: 28.89 },
  { time: "2018-12-28", value: 25.46 },
  { time: "2018-12-29", value: 23.92 },
  { time: "2018-12-30", value: 22.68 },
  { time: "2018-12-31", value: 22.67 },
];

export function App(props) {
  return (
    <ChartComponent
      {...props}
      data={initialData}></ChartComponent>
  );
}