Vite
React.js
Tailwind
Light Weight Charts
HTML
CSS
JavaScript
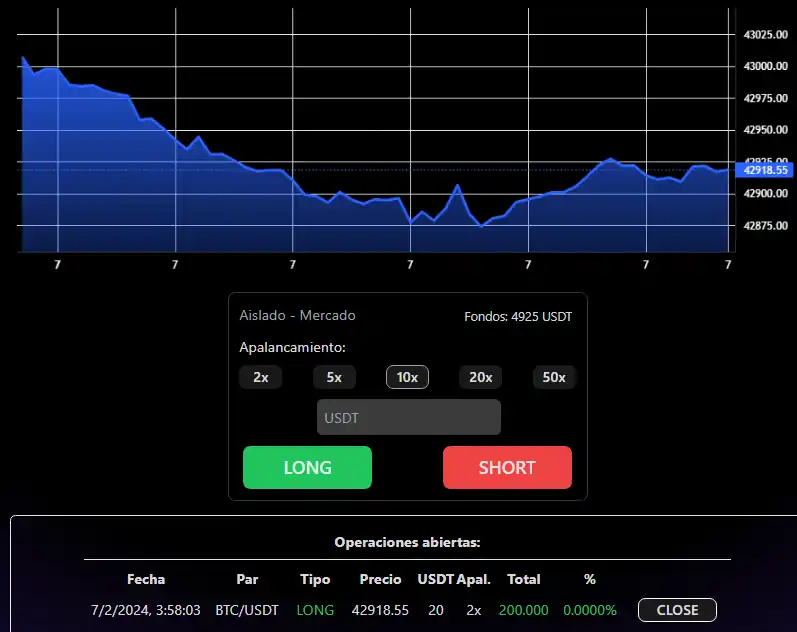
The main purpose for this project was learn/practice some Tailwind and data charts, it was a very short one and I had a lot of fun.

Chart component:
import { createChart, ColorType } from "lightweight-charts";
import React, { useEffect, useRef } from "react";

export const ChartComponent = props => {
  const {
    data,
    colors: {
      backgroundColor = "#161616",
      lineColor = "#2962FF",
      textColor = "white",
      areaTopColor = "#2962FF",
      areaBottomColor = "rgba(41, 98, 255, 0.28)",
    } = {},
  } = props;

  const chartContainerRef = useRef();

  useEffect(() => {
    const handleResize = () => {
      chart.applyOptions({ width: chartContainerRef.current.clientWidth });
    };

    const chart = createChart(chartContainerRef.current, {
      layout: {
        background: { type: ColorType.Solid, color: backgroundColor },
        textColor,
      },
      width: chartContainerRef.current.clientWidth,
      height: 300,
    });
    chart.timeScale().fitContent();

    const newSeries = chart.addAreaSeries({
      lineColor,
      topColor: areaTopColor,
      bottomColor: areaBottomColor,
    });
    newSeries.setData(data);

    window.addEventListener("resize", handleResize);

    return () => {
      window.removeEventListener("resize", handleResize);

      chart.remove();
    };
  }, [
    data,
    backgroundColor,
    lineColor,
    textColor,
    areaTopColor,
    areaBottomColor,
  ]);

  return <div ref={chartContainerRef} />;
};

const initialData = [
  { time: "2018-12-22", value: 32.51 },
  { time: "2018-12-23", value: 31.11 },
  { time: "2018-12-24", value: 27.02 },
  { time: "2018-12-25", value: 27.32 },
  { time: "2018-12-26", value: 25.17 },
  { time: "2018-12-27", value: 28.89 },
  { time: "2018-12-28", value: 25.46 },
  { time: "2018-12-29", value: 23.92 },
  { time: "2018-12-30", value: 22.68 },
  { time: "2018-12-31", value: 22.67 },
];

export function App(props) {
  return (
    <ChartComponent
      {...props}
      data={initialData}></ChartComponent>
  );
}